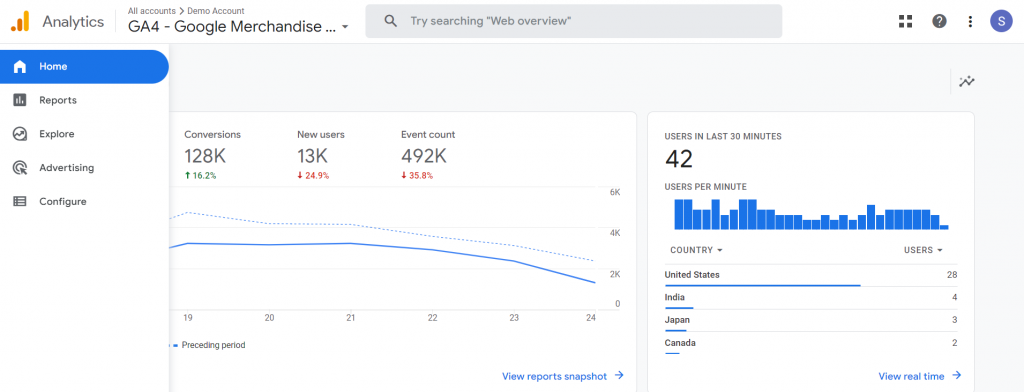
For those who were using the old version of Google Analytics, you should have different profiles for the old version and the new version. You can switch between the two anytime. On the left-hand side of the dashboard, you will find the top-level menu of GA4, which is divided into four main sections, which are “Reports”, “Explore”, “Advertising” and “Configure”.
The report section is pre-selected when you first log in. It will automatically display a report snapshot that summarizes what’s been happening on your site over the past 28 days. This is essentially the home screen you will see whenever you log in. This dashboard is very practical if you are short of time and will give you an overview of the overall performance of your website.
Real-Time Reports
As the name indicates this report will show you what is happening on your site right now. The data that you see here is based on the activity that was captured on your website in the last 30 minutes.
The real-time reporting also has an interesting feature called view user snapshot, when you click on it, you can see how some random users navigate through your website. You can scroll through different users using the card at the top which will show the device that they are using and the location.
The real-time report is very useful when you want to track a specific type of activity such as a promotion, an ad campaign, or anything similar that requires monitoring as it happens.

Life-Cycle Reports
The lifecycle reporting suite is a set of reports that helps you analyze your customer data at every stage of their journey and is like looking at a conversion funnel.
The first stage is Acquisition which is how visitors found your website. It is followed by Engagement which looks at how visitors behave once they’re on your site. And finally, Monetization in when one can look at what these visitors buy, download, or which form they filled in based on the goals that you have set for your website. The last piece of the customer’s lifecycle funnel is Retention which helps you measure customer loyalty or the ability of your website to get visitors to come back for more.

Acquisition Reports
The acquisition report is split into three different subsets of reports. While the first subset is going to provide you with an overview, the user acquisition will focus exclusively on users while the third one will be looking at traffic acquisition. The difference between user acquisition and traffic acquisition is important to understand.
User acquisition: A user is a unique visitor or a person who visits your website. So, the user acquisition report will look at how users have found you.
Traffic acquisition: Traffic to your website is measured in the number of visits called sessions. So, if one person visits your site three times a day, for example, it will be counted as three sessions. The traffic acquisition report will look at where those visits come from.
Engagement Reports
The engagement section will help you understand how your visitors behave on your site based on the events that trigger during their visits. This is where you’ll be able to find out which pages get viewed the most for example the average time visitors spend on your site, what’s their purchasing or downloading, and so on. Just like the acquisition report, this section will be split into four sub-sections starting with an overview. The overview report is a summary of visitors’ behavior and shows some important engagement metrics.
Event – Events are user interactions. Typical events would be a page view, someone scrolling down a page, clicking on a button, viewing a product, and so on.
This is central to how Google Analytics works and, provides insight into what’s happening on your site.
Monetization Reports
The monetization report section is mostly geared toward those of you who sell physical products through an eCommerce store or subscriptions to a service. You’ll need to set up events with the right parameters according to Google’s recommendations so you can collect the relevant data before you can use these reports.
The e-commerce purchases report will display data specific to the items themselves. This is a very simple report as you will be able to figure out what your most popular products are, which ones bring the most revenue, which ones are the most viewed, etc., and improve your site accordingly.
If you are running an app then the in-app purchases report will show you the number of purchases being made in your apps while the publisher ads report will enable you to measure the revenue you generate from the ads in your mobile app.
Retention Reports
These reports will show you the data that helps you understand how frequently and for how long users engage with your website or mobile app after their first visit. The retention report will also help you understand how valuable users are based on the additional revenue you generate after their first visit.
User Reporting
This section is split into two, one related to demographics, and one related to technology. The demographics report will help you understand who your customers truly are, where they are located, their gender, their age, their interests, and more being able to identify your audience types is critical if you want to create content that resonates with them you wouldn’t want to publish content about early retirement on your site if most of your audience is aged between 25 and 30.
To be able to provide the best experience for them you also, want to know the type of devices they use, on what platform, which operating system they are on, etc. And you will find all this information under the tech option.

Demographics Reports
Here you’ll find the geographical locations of your users by country but also by city as well as where the current users are located in real-time. You will also find out your audience’s gender split and what they are most interested in. Google can collect this data from all users who have some sort of Google account such as Gmail, Google Drive Google doc, YouTube, and so on, and bring it in as part of the demographics report. The data is anonymous.
Also, find out what the most popular age groups are and the most popular languages. Straightaway you can see how valuable this data is and do some quick analysis. For example, if you are looking for more local information, you can drill down to the city level. The better you understand the audience, the easier it will be to produce the right content and capitalize on it.
Tech Reports
Here you’ll find the most popular platforms your users are on, the operating system they use, their browsers, which type of devices such as desktop, mobile, or tablet, screen resolution, and more. This data will help you display a consistent experience across all platforms and devices.
As usual, you can dive deeper into the data by clicking on the tech details option and drill down into specific aspects to help you make decisions.
Analysis Hub (Exploration)
This is the most advanced part of GA4 and will help you take your analysis to the next level. If you click on the template link, you’ll see a list of predefined reports or what Google calls techniques that will help you uncover deeper insights into your customer’s behavior. From path analysis to funnel exploration and use cases, there are plenty of techniques to choose from. Alternatively, you can create your very own using a blank one.

Path Analysis
Path analysis is one of the most popular ones. This technique will help you understand how your visitors progress throughout their visits from the moment they land on your website. It basically displays the breakdown of the most popular pages from which visitors start their visit. You can expand the selection by clicking on “more”. You can add more dimensions to the report using the options available in the variable column on the left-hand side.
The path exploration technique will help one find the top pages that users open after opening the home page, uncover looping behavior that may indicate users becoming stuck, and more.
Advertising Hub
The advertising hub is all about tracking the marketing activity that drives traffic to your site such as newsletter campaigns, paid and organic traffic, affiliate traffic, and so on. These reports focus mostly on attribution and attribution models.

Configuration Hub
In this hub, you’ll find a list of the configuration options you can play with to fit your analysis needs. You can configure, modify, or create new events, create new conversions, create new audience types and set up new custom dimensions. There is also what is known as the debug view which will enable you to check incoming data in your Google Analytics account.
Using the configure hub, you can set up a basic conversion for your website so you can measure its effectiveness.